Reports
Allergen Export Report
The allergen export report displays each of the menu items, their associated allergens and ingredients to track. Data for monthly menus and concept menus will appear slightly differently. Those differences are explained below. To execute the report, follow the steps below:
Select the date range for which you want to run the report. The system will look up the items which are on the menu between these dates.
Select one or more accounts whose menus you want the system to return data for. Leaving this field blank will run the report for all of the accounts that you have access to. Otherwise you can choose one or more specific accounts.
Select one or more locations you want to return data for. Leaving this field blank will run the report for all locations that you have access to and which are associated to the account selected (if any).
Click the Submit button
The system will return the list of items that are on the menu. Each location/date/meal period will be listed on it’s own page. You can use the arrows to navigate between pages. Monthly menus will not list a concept in first column. If a food bar is present on a monthly menu, the food bar name will appear in the Concept/Food Bar column next to the items which are associated to it on the menu. Concept menus will display the concept each item is associated to in the Concept column of the menu. It will also display the food bar name next to the concept for the items that are associated to both.

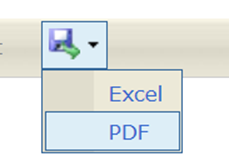
Export this report to PDF or excel by clicking on the disk icon. Select “excel” to export to excel, select “PDF” to export to a PDF.

Daily Menu/Week At Glance/Nutritional Analysis/Cost Analysis
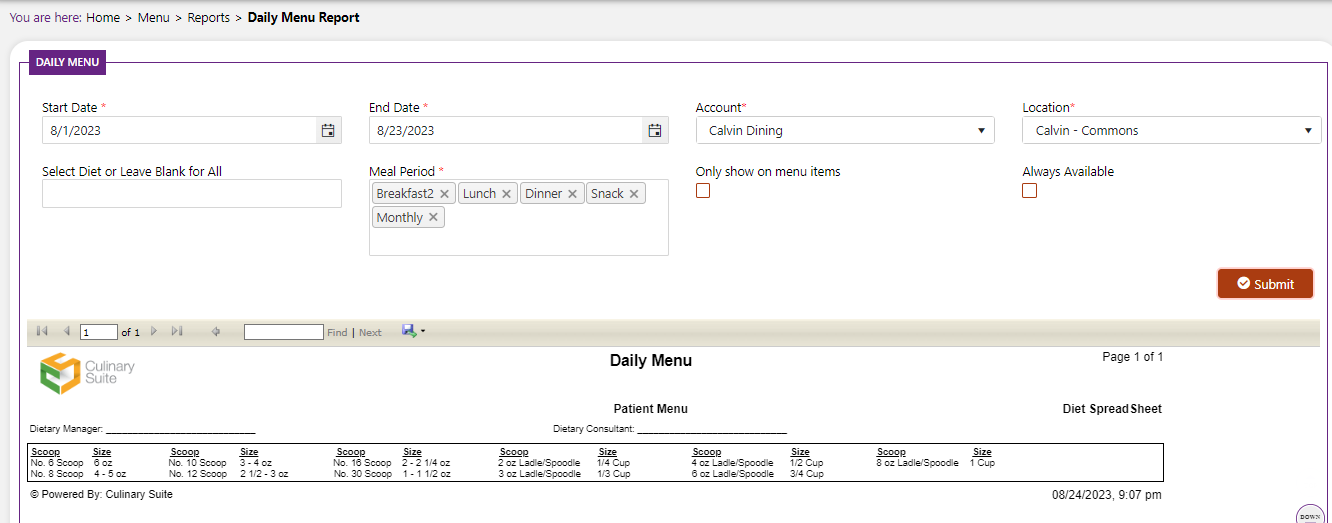
The Daily Menu, Week At Glance, and Nutritional Analysis reports will display the menu or menus in a format organized by Meal Period, Low Sodium, Renal, and Days. The Daily Menu will be organized into days while the Week At Glance will format the menus by weeks. Nutritional Analysis will be formatted by nutrients in the items offered on the menu. Users can take this report to find items that are suitable for their meals. This also includes sizing and unit composition which can be helpful to track how much of each item a customer is consuming.
In order to generate these menus, users must input the following information:
Start Date
End Date
Account
Location
“Select Diet or Leave Blank”- users will be presented with two options: Low Sodium or Renal. By leaving the field blank, the menu will automatically include both.
Meal Period
Only Show On Menu Items- Click this box if you want to only show items on the menu. After you have inputted the information above, click the Submit button to generate the report.
Daily Menu:
Week At Glance:
In the week at a Glance, a new feature has been added to either show the WAG report with menu items, portion size, Dietary rules and the legend or simply the menu items alone. This is determined by selecting the ‘Customer Facing Report Flag’.
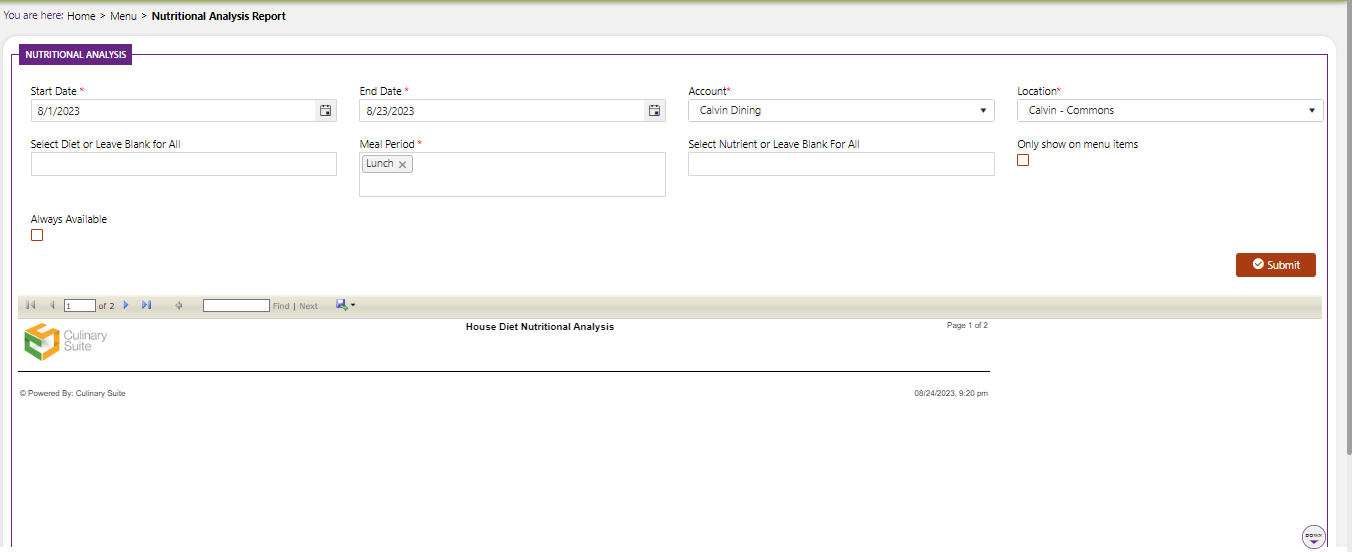
Nutritional Analysis:
The reports will generate at the bottom of the CulinarySuite website page. Each page of the report will be used for a different day between the Starting Date and End Date period for the Daily Menu.
For the Week At Glance, the menu will be formatted by weeks.
For Nutritional Analysis, the menu will be formatted by nutrients.
Click the icon as seen in the picture below to export as an Excel sheet or a PDF file.

Weighted Nutrition Analysis
Weighted Nutrition Analysis gives the user more specific information about the nutritional analysis allowing the user to control what nutrients to display, the analysis type, and the weighting type. This will allow users to see a more specific report than the report generated in the Nutritional Analysis section.
In order to generate the report, users must input the following information:
Start Date
End Date
Account
Location
“Select Diet or Leave Blank”- users will be presented with two options: Low Sodium or Renal. By leaving the field blank, the menu will automatically include both.
Meal Period
“Include Inactive Accounts/Locations”- Click this to include the inactive accounts in the report.
Analysis Type- Choose to sort the analysis by portion type or weighted analysis.
Weight Using- Choose to either have the menu forecast or production record served reimbursable.
Nutrient to Display- Choose any nutrients you want to display on this report. Users can choose more than one to display. After you have inputted the information above, click the Submit button to generate the report.
Single Nutrient Report
A single nutrient report is a type of nutritional analysis that focuses on the content of a specific nutrient in a food item or a group of foods. It provides detailed information about the quantity of a particular nutrient present in the food, typically expressed in standardized units (e.g., grams, milligrams, micrograms) per specified serving size.
For example, if you want to know how much vitamin C is present in an orange or how much protein is in a chicken breast, a single nutrient report will give you that specific information.
To generate the report, users must input the following information:
Start Date
End Date
Account
Location
“Select Diet or Leave Blank”- By leaving the field blank, the menu will automatically include data.
Meal Period (Breakfast, Lunch,Dinner,Snack,Lunch Entrée)
Select Nutrient (Calories, Fat, Carbohydrates etc.)
Only Show on Menu Items- Click this box if you want to only show items on the menu. After you have inputted the information above, click the Submit button to generate the report.
Export this report to PDF or excel by clicking on the disk icon. Select “excel” to export to excel,
select “PDF” to export to a PDF.

Here's what you might find in a single nutrient report:
Food Item: The name of the food being analyzed, along with any relevant details like the specific variety or preparation method (e.g., raw, cooked, boiled).
Serving Size: The amount of the food item that was analyzed. This is important because the nutrient content is typically measured per specific serving size.
Nutrient Content: The report will provide the amount of the specific nutrient in the food item. For example, it might show the amount of vitamin A, calcium, iron, protein, or any other nutrient of interest.
Measurement Units: The units in which the nutrient content is expressed. This could be grams (g), milligrams (mg), micrograms (mcg), international units (IU), or other appropriate units.
Single nutrient reports are valuable tools for individuals, nutritionists, and health professionals who want to understand the nutritional composition of specific foods, assess dietary intake of nutrients, or monitor their nutritional needs.
Cost Analysis Report
A Menu Cost Analysis Report is used in the foodservice industry to assess and analyze the costs associated with a menu item. This report provides valuable insights for restaurant owners, managers, and chefs to understand the profitability and financial performance of individual menu items and the overall menu.
To generate the report, users must input the following information:
Start Date
End Date
Account
Location
“Select Diet or Leave Blank”- users will be presented with two options: Low Sodium or Renal. By leaving the field blank, the menu will automatically include both.
Meal Period (Breakfast, Lunch,Dinner,Snack,Lunch Entrée)
Select Nutrient (Calories, Fat, Carbohydrates etc.)
Only Show on Menu Items- Click this box if you want to only show items on the menu. After you have inputted the information above, click the Submit button to generate the report.
Export this report to PDF or excel by clicking on the disk icon. Select “excel” to export to excel,
select “PDF” to export to a PDF.
The Menu Cost Analysis Report typically includes the following key components:
Cost of Ingredients: This section lists all the ingredients used in each menu item and their respective costs. It helps identify the direct cost incurred in preparing a dish.
Recipe Yield: The report may include the yield of each recipe, which indicates the quantity of the final product that a particular amount of ingredients can produce.
Portion Size and Cost: This section details the portion size served to customers and the cost associated with that portion. It allows the restaurant to understand the cost of each serving.
WA/MP: Weekly Average per Meal Period WA/MP represents the average number of meals served per week during a specific meal period (e.g., breakfast, lunch, dinner). This metric helps foodservice establishments understand the average demand for meals over the course of a week within a particular meal period (To calculate the Weekly Average per Meal Period, you would typically sum up the total number of meals served during the week for a specific meal period and then divide that total by the number of days in that meal period. For example, if a restaurant served 1,400 meals during lunch over a week with 5 lunch days (Monday to Friday), the WA/MP for lunch would be 1,400 meals / 5 days = 280 meals per day.)
Nutrient Standard Report
A "Nutrient Standard Report" would likely refer to a standardized report that provides information about the nutrient content of a food item or a meal. Such a report could be used by individuals, healthcare professionals, food manufacturers, and regulatory authorities to understand and compare the nutritional value of different food products.
Nutrient Composition: The report would list the various nutrients present in the food item or meal, such as macronutrients (carbohydrates, proteins, fats) and micronutrients (vitamins and minerals). The nutrient values would be expressed in standard units (e.g., grams, milligrams, micrograms) per serving or portion size.
To generate the report, users must input the following information:
Program Type (1500 Calorie, 1 gram sodium, Bariatric 1 etc.)
Meal Period (Breakfast, Lunch, Dinner, Snack, Lunch Entrée)
Menu Grade (Pre-school-12, Pre-school-2, Pre-school-3, others etc.)
Export this report to PDF or excel by clicking on the disk icon. Select “excel” to export to excel,
select “PDF” to export to a PDF.