Appendix
POS Legends
Use the legends below to help map the items on your POS report to the fields in Dine Central.
NutriKids POS
Winsnap POS
Revenue Dashboards
For your convenience, six report dashboards have been created so you can view the performance of your account(s): District Recap, Sales Compared Budgeted Sales, Whitsons Recap, Actual Average Daily Sales Compared to Avg. Budgeted Daily Sales and Meals Per Labor Hour. Each of the Revenue dashboards may sorted, filtered, drilled-down, then exported Excel and/or printed.
Corporate accounting, DM's, VP's and account management staff have access to the dashboards for his/her accounts.
Access Revenue Dashboards
All of the Revenue report dashboards are accessible via the Revenue home page.
To access revenue dashboards:
Click the Revenue icon. The Revenue Dashboards appear:
District Recap
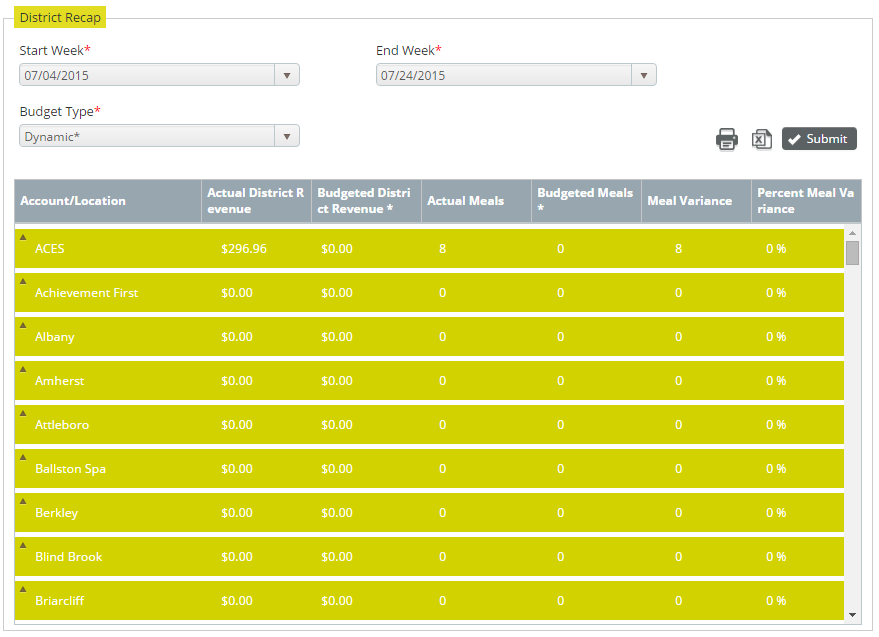
The District Recap dashboard allows you to view your district revenue in various levels of detail. After choosing your report parameters, you can drill down into each account to see how the data is calculated.
Note: One report parameter is Budget Type where you have two choices:
Dynamic: Display the budgeted meals and budgeted district revenue based on actual operating days.
Not Dynamic: Display the budgeted meals and budgeted district revenue based off of the budgeted operating days.
To view the district recap:
Access the Revenue Dashboards.
Choose your report parameters in the District Recap section: Start Week, End Week and Budget Type.
Click Submit. The results appear in the dashboard window:
Click into each Account to display the totals for each category (e.g. breakfast).
Click a Category to break down the data even further.
Sales Compared Budgeted Sales
The Sales Compared Budgeted Sales dashboard compares the actual sales data entered to the sales amount you budgeted for in the fiscal year and displays it in a graph format. After choosing your report parameters, you can drill down into each account to see how the data is calculated.
Note: Although this dashboard can be exported to Excel, the graph does not export, just the data.
To view sales compared to budgeted sales:
Access the Revenue Dashboards.
Choose your report parameters in the Sales Compared Budgeted Sales section: Account and Meal Category.
Click Submit. The results appear in the dashboard window:
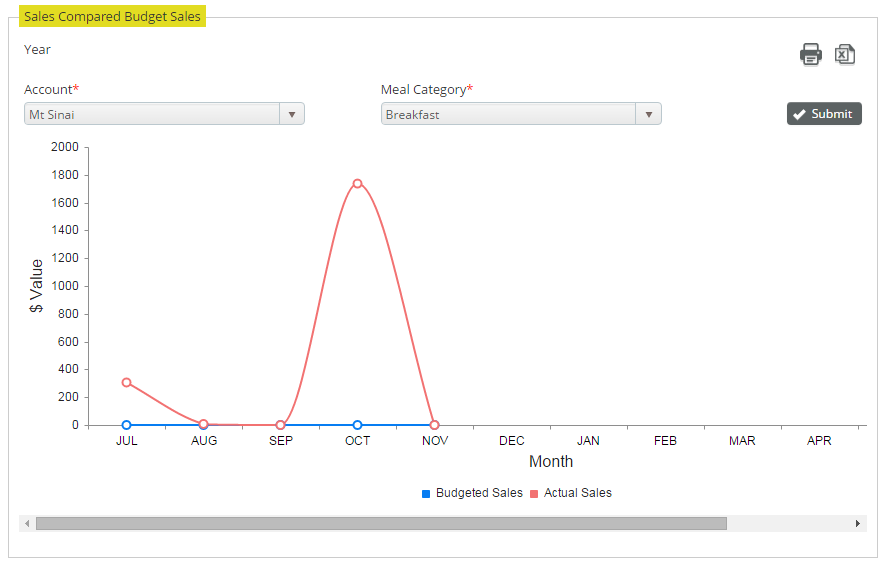
Hover your mouse over the circle points on the graph to view the associated dollar amount.
Click a circle point on the graph to open a window with additional details per location in that account.
Participation by Meal Category Charge Type Combination
On the Participation by Meal Category Charge Type Combination dashboard you can view the participation rates for the meal count programs offered in each of your locations by fiscal year.
To view participation by meal category charge type combination:
Access the Revenue Dashboards.
Choose the Year in the Participation by Meal Category Charge Type Combination section. The results appear in the dashboard window:
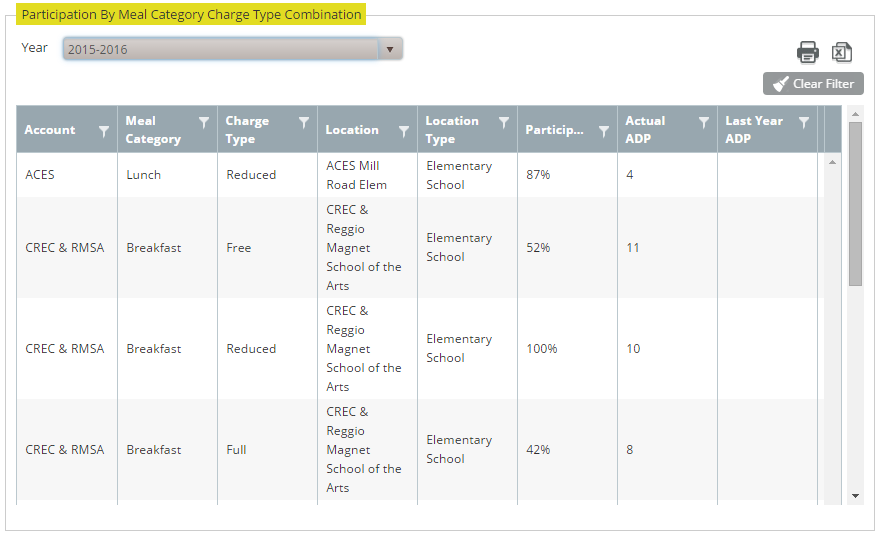
Click any of the column headings to filter on that item. You are prompted to input your filter criteria:

Input your criteria and click Filter. The filter is applied.
Actual Average Daily Sales Compared to Avg. Budgeted Daily Sales
The Actual Average Daily Sales Compared to Avg. Budgeted Daily Sales dashboard compares the actual daily sales data entered to the amount you budgeted for daily and displays it in a graph format. Actual values are calculated by summing the sales values entered for the month then dividing by the number of operating days in that month. Budgeted values are calculated by summing the budgeted sales for the month then dividing by the number of operating days in the month. After choosing your report parameters, you can drill down into each account to see how the data is calculated.
Note: Although this dashboard can be exported to Excel, the graph does not export, just the data.
To view the actual average daily sales compared to avg. budgeted daily sales:
Access the Revenue Dashboards.
Choose your report parameters in the Actual Average Daily Sales Compared to Avg. Budgeted Daily Sales section: Account and Meal Category.
Click Submit. The results appear in the dashboard window:
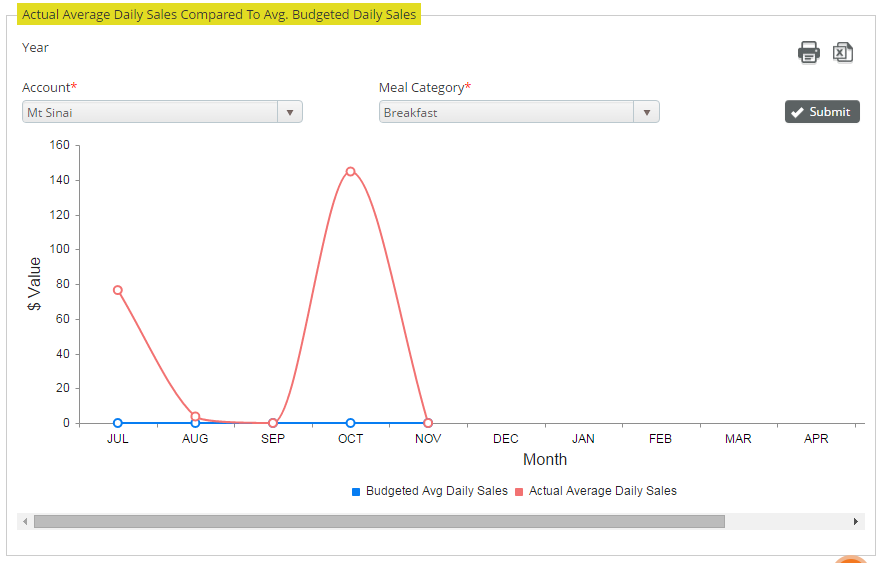
Hover your mouse over the circle points on the graph to view the associated dollar amount.
Click a circle point on the graph to open a window with additional details per location in that account.
Whitsons Recap
The Whitsons Recap dashboard allows you to view Whitsons revenue and expenses in various levels of detail. After choosing your report parameters, you can drill down into each account to see how the data is calculated.
Note: One report parameter is Budget Type where you have two choices:
Dynamic: Display the budgeted meals and budgeted revenue based on actual operating days.
Not Dynamic: Display the budgeted meals and budgeted revenue based off of the budgeted operating days.
To view the Whitsons recap:
Access the Revenue Dashboards.
Choose your report parameters in the Whitsons Recap section: Start Week, End Week and Budget Type.
Click Submit. The results appear in the dashboard window:
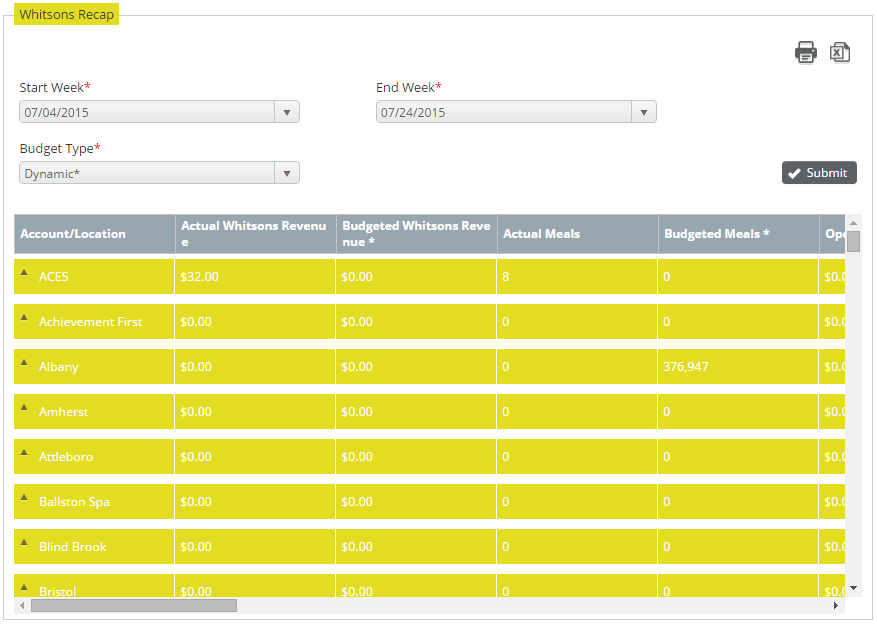
Click into each Account to display the details for each school in that account.
Click a Category to break down the data even further.
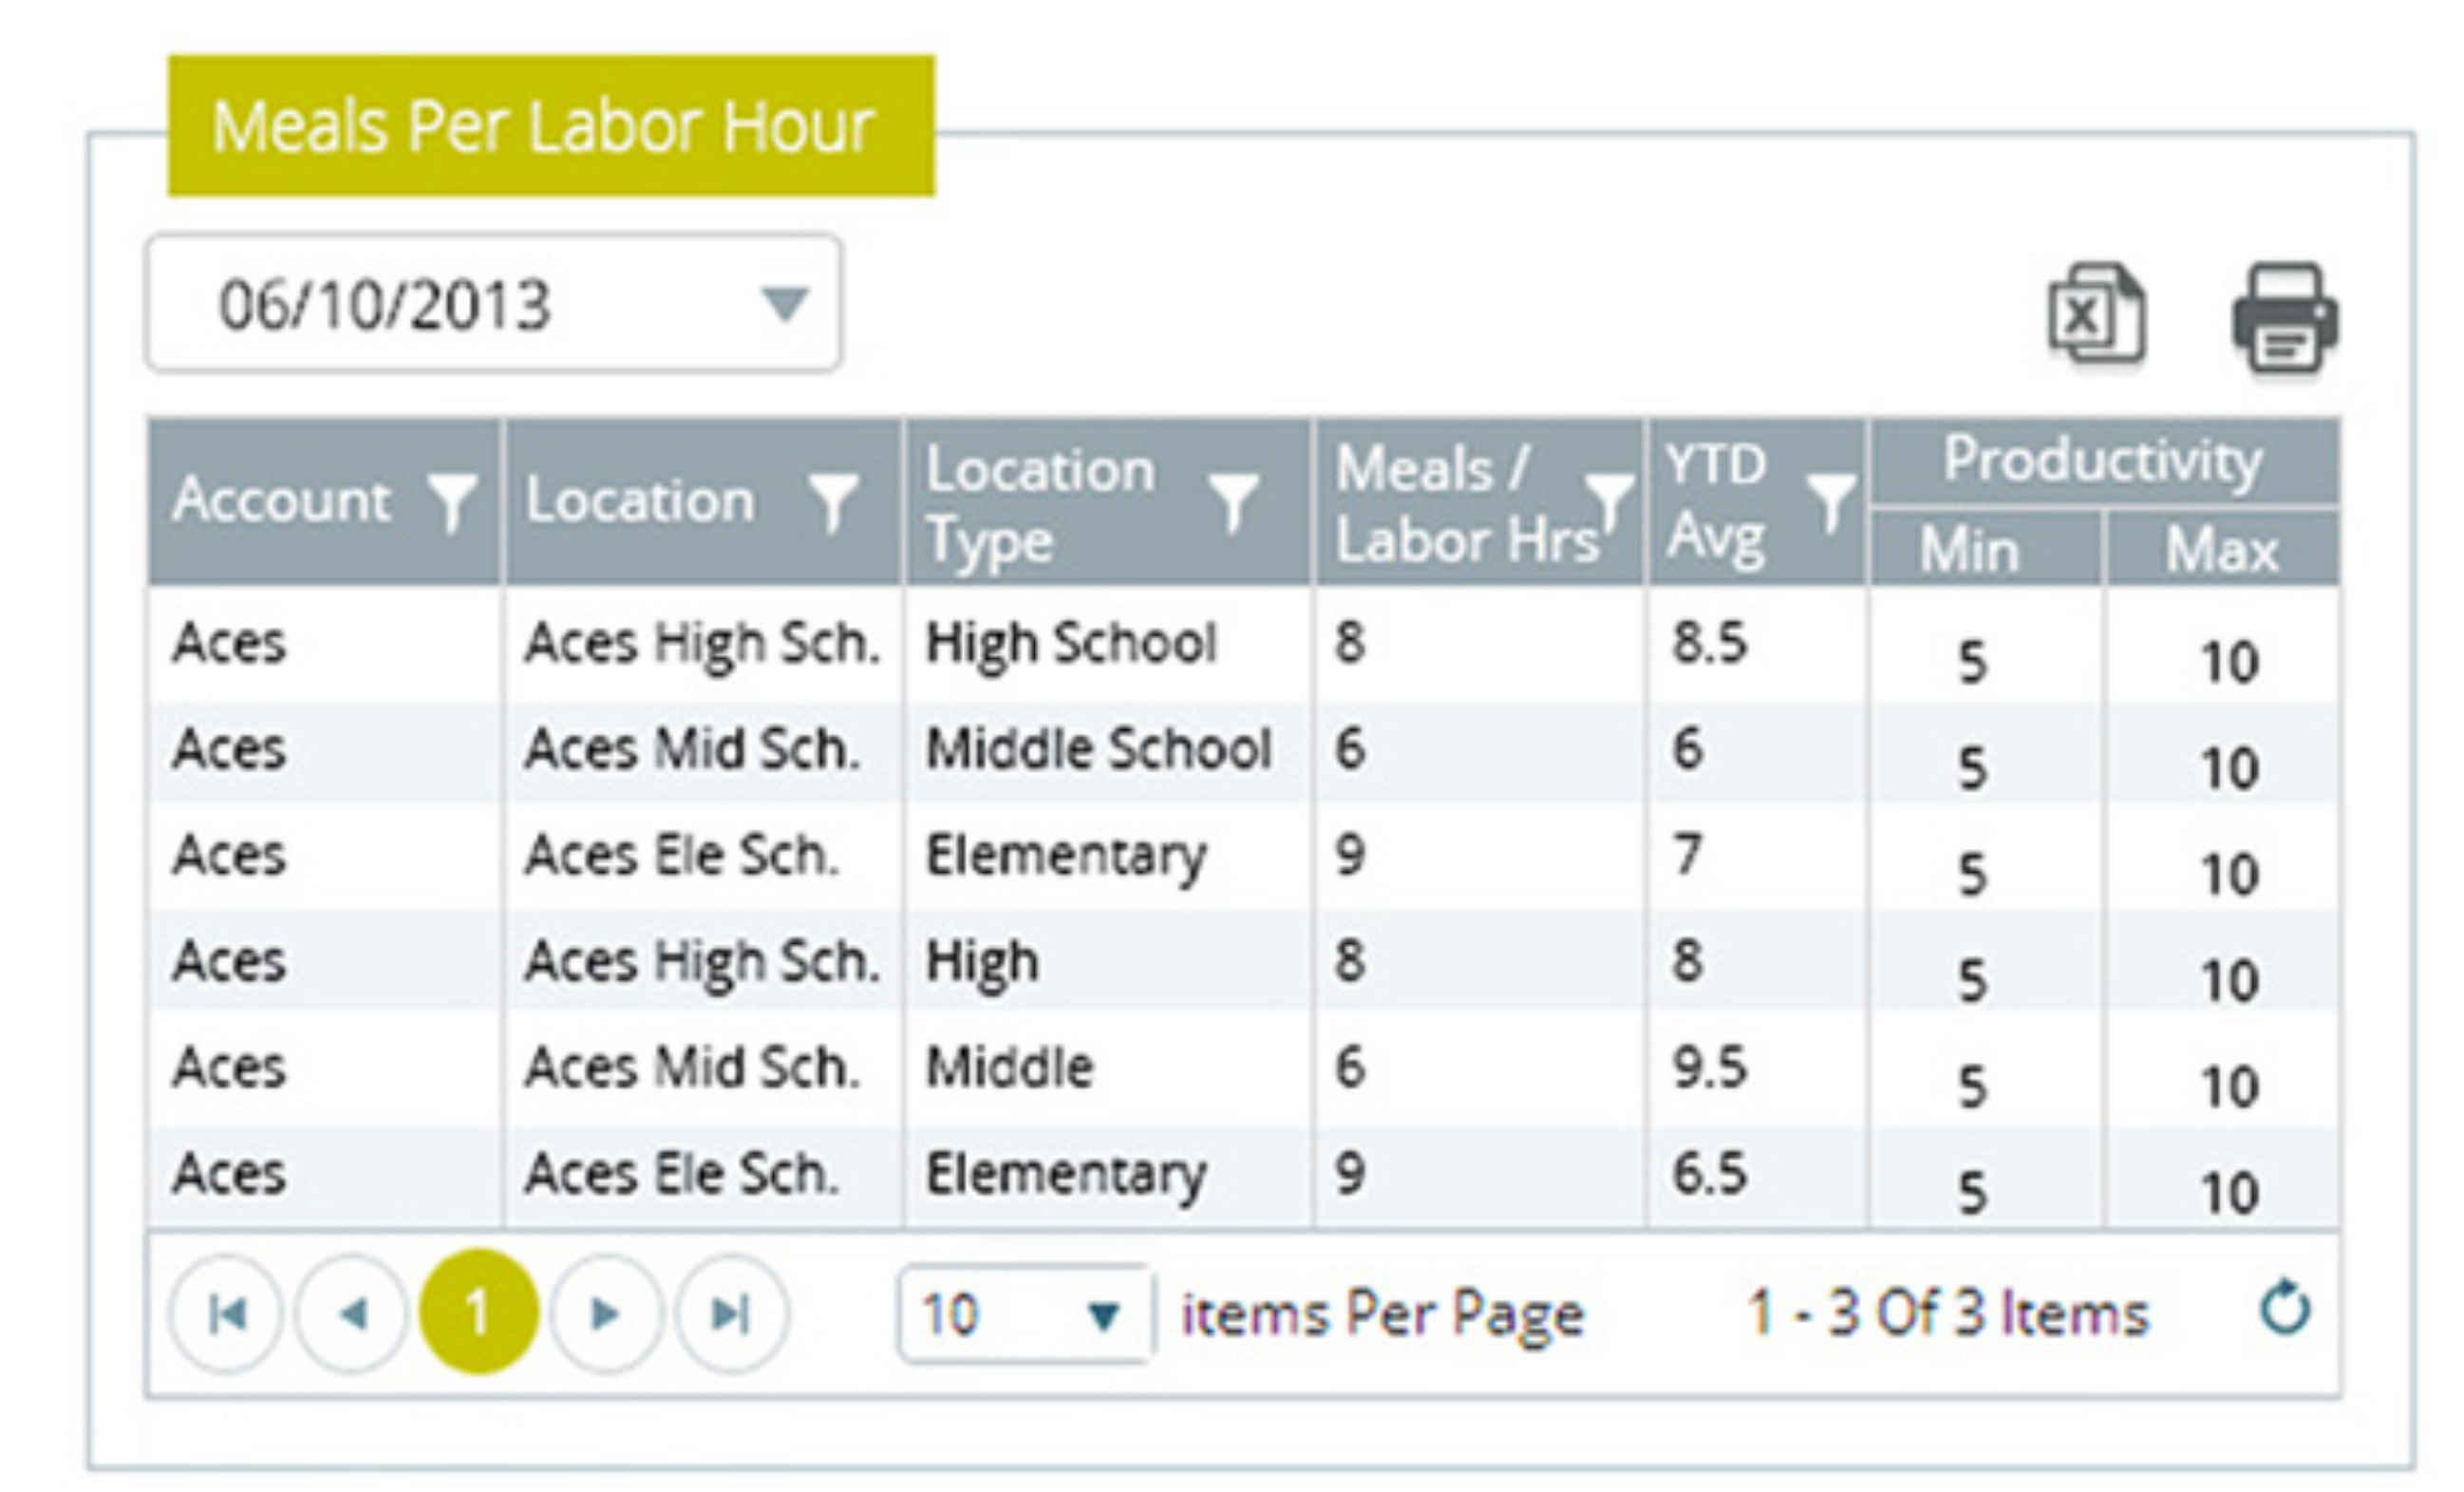
Meals Per Labor Hour
On the Meals Per Labor Hour dashboard you can view the meals per labor hour and average meals per labor hour for a specific fiscal week.
Select the fiscal week (the drop down shows the ending of the fiscal weeks) from the drop down. The information calculated will be displayed for each account/location that the user has access to for the fiscal week ending selected.
To view meals per labor hour:
Access the Revenue Dashboards.
Choose the week you want to view from the drop-down parameter in the Meals Per Labor Hour section. The results appear in the dashboard window:
Export to Excel/Print
You can export any Revenue Dashboard report to Excel or print it.
Note: Any active filters you applied will export/print. For example, if you filtered the report to show only one account then only the data for that account will be printed or exported. If you wish to print all of the records, you may clear your filters and all of the visible information will print or export.
- To export to Excel, access the dashboard you wish to the export and
click the Excel
 icon.
icon.
OR
- To print a dashboard, access the dashboard you wish to print and
click on the Printer
 icon.
icon.